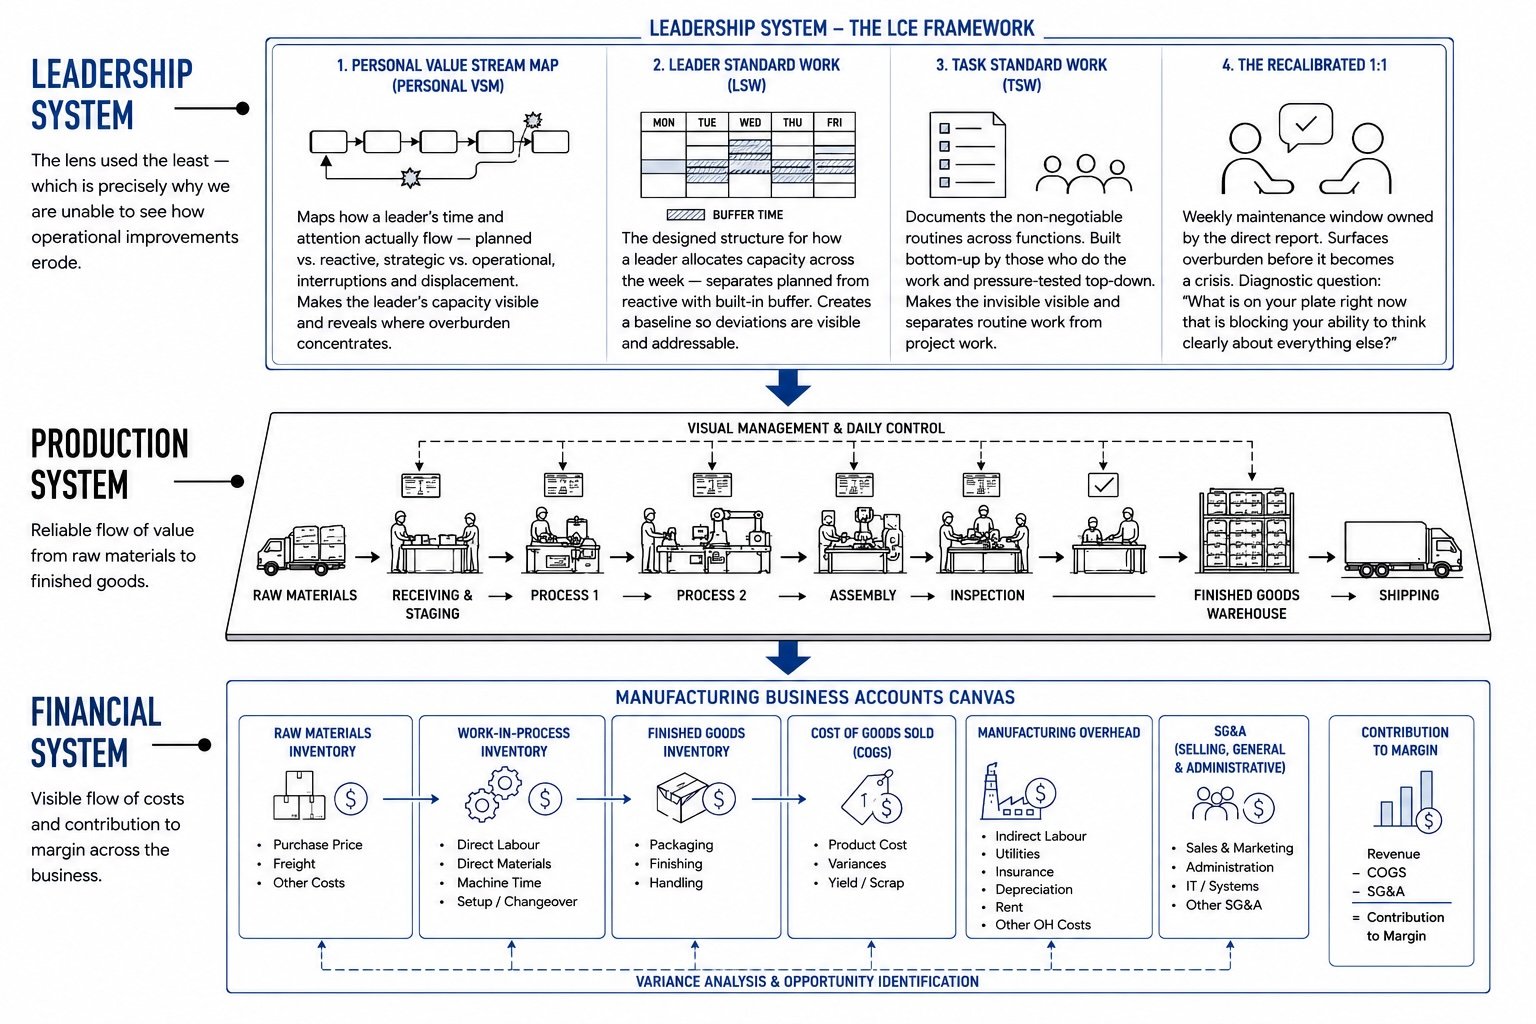
Most lean programs deliver the early wins. There are measurable performance improvements. Everyone celebrates. Then, the next organizational pressure redirects the efforts to another activity. You start seeing the improvements eroding
The usual explanation given is discipline, culture, or change management. But the actual explanation is simpler and more diagnosable: the leadership layer above the floor has been running at overburden (Muri) for months, producing degraded output, and nobody has built a measurement system to detect it.
On the production floor, you would catch this immediately. For the leadership system, there is no equivalent instrument. That is the design problem this post addresses.
The Consequence of Running at 110%
A production line running at 110% capacity does not produce more. It will start to degrade. It will produce defects. And eventually it fails.
You already know this. You have seen this on the floor.
The question is why you are applying different logic to yourself.
If you are always running beyond your capacity, you would think you will notice your energy draining away. But usually that is not the case. The first thing to lose is your decision quality.
The leader running over capacity does not collapse suddenly. The degradation happens gradually. The decisions that used to take 10 minutes now need an hour. Something that had an obvious solution now needs three to four conversations to resolve. The work that requires deep thinking and your full cognitive capacity gets done… but not at the quality it used to be.
The changes are subtle. Initially, you don’t even notice them. Even when they become visible, you are more likely to ignore them, thinking it is just a temporary problem. You will catch up next week. But that does not happen.
On the production floor, you would immediately catch the first-pass yield dropping. Cycle time creeping. You would investigate this immediately because the data tells you something is wrong.
But for yourself, there is no dashboard. No over-utilization alert. No system is telling you that your decision quality has been degrading for the past seven weeks.
The Measurement Gap
If you have a critical piece of machinery on the shop floor, you will ensure you have all the operating measurements to show it is running smoothly.
You are the most critical system in your operation. But there is no equivalent measurement system in place.
This is not an oversight. It is a design problem. Tools for measuring the performance of production processes have been developed and perfected over decades. Tools to measure leadership capacity are newer, and most organizations have never used them.
When the production line degrades, the data tells you within hours. When the leadership system degrades, the signal takes weeks or months to surface, and by then it has already produced the downstream waste your lean program was designed to eliminate. Rework from inconsistent decisions. Realignment meetings that shouldn’t exist. Good people quietly recalibrating to a lower standard because the system above them normalized it.
You cannot optimize what you cannot see. The first step in the Muri→Mura→Muda sequence is making the overburden visible. That requires measurement. And measurement requires a mechanism.
The Personal Value Stream Map
A Personal Value Stream Map applies the same logic as a production VSM to your 168 hours per week.
It maps where your time and cognitive capacity are actually going, not where you think they are going, and not where your calendar says they should be going. Where they are actually going.
Most leaders who complete a Personal VSM for the first time discover two things. First, the gap between their assumed allocation and their actual allocation is significant. Second, the activities consuming the most capacity are frequently not the activities producing the most value.
That gap is where the overburden (Muri) lives. It is usually not the big visible commitments. It is in the small accumulated demands that never get measured individually, but together consume the buffer capacity the system needs to function.
The most consistently underestimated category is context switching. The cognitive cost of transitioning between fundamentally different types of work: moving from a supplier escalation to a strategic planning conversation to a budget review to a direct report’s performance concern, all within the same two-hour window. Each transition has a re-entry cost. That cost never appears on any calendar. Collectively, across a week, it represents a significant fraction of available capacity. The capacity that the leader is paying for but not counting.
A Personal VSM makes that cost visible for the first time. Not as a feeling. As a measurement.
Current State vs. Future State
A VSM produces two pictures. The current state, what is actually happening and the future state, what the system should look like when it is designed to produce sustainable output.
The current state map is often uncomfortable. It shows clearly that the system was not designed; it just happened. Demands were added without removing anything. Commitments compounded without measuring the load. The week that looks manageable on Sunday night is unrecognizable by Wednesday afternoon, and there is no reason it should be otherwise.
The future state map answers a specific question: what does a week look like for a senior operations leader operating at sustainable utilization, with necessary buffer capacity intact, highest-value work protected, and the system designed to absorb variation without degrading?
That picture does not exist in most organizations because nobody has ever drawn it. The Personal VSM is how you draw it.
The design principle for the future state is not minimization; it is protection. The future state is not a lighter schedule. It is a designed schedule. The highest-value work goes in first: coaching conversations, strategic thinking time, and improvement reviews. Those are the non-negotiables. Everything else is scheduled around them, not instead of them. Buffer capacity (time deliberately left unscheduled) is sized based on the actual variation in unplanned demand the leader experiences, not on an optimistic basis. If the current state map shows that three to five unplanned hours are consumed each week by escalations and reactive conversations, the future state builds that in as a designed feature rather than a recurring surprise.
The gap between the current state map and the future state map is the engineering problem. It is specific. It is measurable. And it is solvable using the same improvement logic you apply to any production constraint.
Identifying Muri, Mura, and Muda in Your Own Workflow
Once you have the current state map, the three categories apply directly.
Muri shows up as the commitments and demands that consistently exceed what the system can absorb, the recurring overload that never resolves because it is systemic, not situational. This is not an unusually difficult week. This IS your standard week. If the standard week is already at 105% allocation before anything unplanned arrives, the system is in Muri (overload). This is happening every week. Without exception.
Mura shows up as the variation in the weeks that are manageable, followed by the weeks that are impossible, with no system to level the demand between them. For most operations leaders, the variation is not random. It follows a pattern: quarter-end reporting cycles, product launch cycles, budget cycles, customer review cycles. Mura that follows a predictable pattern is Mura that can be anticipated and absorbed, but only if the system has been designed to do so. Without the map, the pattern remains invisible, and the variation continues to consume the buffer that doesn’t exist.
Muda shows up as the non-value-add activities consuming capacity that should be going to coaching, strategic thinking, and developing your people. The meetings with no clear purpose. The approvals that shouldn’t require your involvement. The reporting that exists because it always has. The status updates that substitute for the visual management that was never built. These are not small inefficiencies. In aggregate, they represent the capacity your lean transformation needs to hold.
The sequence for addressing them remains the same. Muri first. Always.
You cannot level the variation on top of an overloaded system. You cannot eliminate waste from a structurally unstable system. Address the overburden first. Then the variation. Then the waste. In that order, for the same reason as it applies on the floor: an overloaded system consumes every improvement you make to it. Stability before optimization. Every time.
The diagnostic question worth sitting with this week:
If you mapped your own 168 hours the way you would map a production value stream where value is being added, where it isn’t, where the system is carrying waste it doesn’t need, what would the current state look like?
That map is the starting point. Everything that follows is an improvement.