A Manufacturing Case Study in EBITDA Compression and Post-Acquisition Leadership Instability
Note: This is a composite case illustration built from patterns observed across more than twenty years of manufacturing operations experience and current market conditions. Company name, personnel, and financial details are constructed for illustrative purposes. It is not a specific client engagement. Full disclosure appears at the end of this article.
When a manufacturing company’s EBITDA drops by 420 basis points over 18 months with no meaningful revenue decline, the first thought is to look at the cost structure. That is not a wrong instinct. But where you look inside the cost structure and what conclusions you make from it determines whether you solve the problem or make it worse.
This case follows HWC Assembly Solutions and its margin compression, which nearly resulted in a headcount reduction that would have affected the operational capability the business needed most. The numbers told a different story from the one being understood. This article walks through how the story was uncovered, what was actually driving the compression, and what an operational intervention, rather than just a financial one, was designed to do about it.
The Company
Company: HWC Assembly Solutions
Location: Ontario, Canada
Size: 185 employees
Structure: Single-site operation; privately held. Acquired 18 months ago by a regional PE firm as part of a 3-company industrial roll-up
Products: Custom-engineered hydraulic and pneumatic sub-assemblies for OEM customers in material handling, municipal infrastructure, and light construction equipment. Build-to-spec, not catalogue. Average order value $8,000–$45,000.
Volume: 280–340 sub-assembly units per month across 6 active OEM accounts. Two accounts represent 61% of revenue. Lead times quoted at 6–8 weeks; currently running 9–12 weeks on most orders.
Revenue: ~$28M trailing twelve months. EBITDA was 11% at acquisition; currently tracking at 6.8%: 420 basis points of margin erosion in 18 months.
Workforce: 3 shift supervisors, 1 plant manager (promoted internally 14 months ago, first management role), VP Operations (retained from previous ownership), 4 engineers, balance hourly assembly and materials.
The Situation
The problem, as described by the VP of Operations:
VP Operations, HWC Assembly Solutions
“We’re not generating enough cash, and the PE firm is asking questions we don’t have clean answers to. We ran well under the old owner. Something changed after the transition, and we haven’t been able to put our finger on it.”
What the numbers show:
- EBITDA compression from 11% → 6.8% with no meaningful revenue decline
- Inventory carrying costs up 22% year-over-year; WIP has grown without a corresponding increase in throughput
- OTD at 71% against customer expectation of 90%+; two of six OEM accounts have issued formal performance notices
- Overtime running at 14% of total labour hours for 11 consecutive months, budgeted at 4%
- One key engineer resigned 8 months ago; the role has not been backfilled; the VP Ops absorbed the workload informally
What the PE firm is pressing for:
Six months ago the PE firm had brought in a part-time CFO to tighten financial reporting. Monthly EBITDA reviews were set up. This had started the conversation about headcount reduction as the primary lever for recovering from compressed EBITDA.
The CFO’s analysis had identified a productivity ratio problem: revenue per employee was down, overhead as a percentage of revenue was up, and the analysis concluded that removing $680,000 in fully loaded labour costs would close most of the margin gap.
Eight to twelve positions were identified through labour productivity analysis. The VP of operations was resisting, but she did not yet have a counterproposal backed by numbers.
What is actually happening at the leadership layer – as observed, not yet diagnosed:
The plant manager promoted from within has no standard work for his role and no structured handoff from the previous manager. He runs on the “tribal knowledge” and relationships. His decisions are consistent when the floor is stable; when OEM escalations hit, his availability collapses, and the floor reverts to informal coordination.
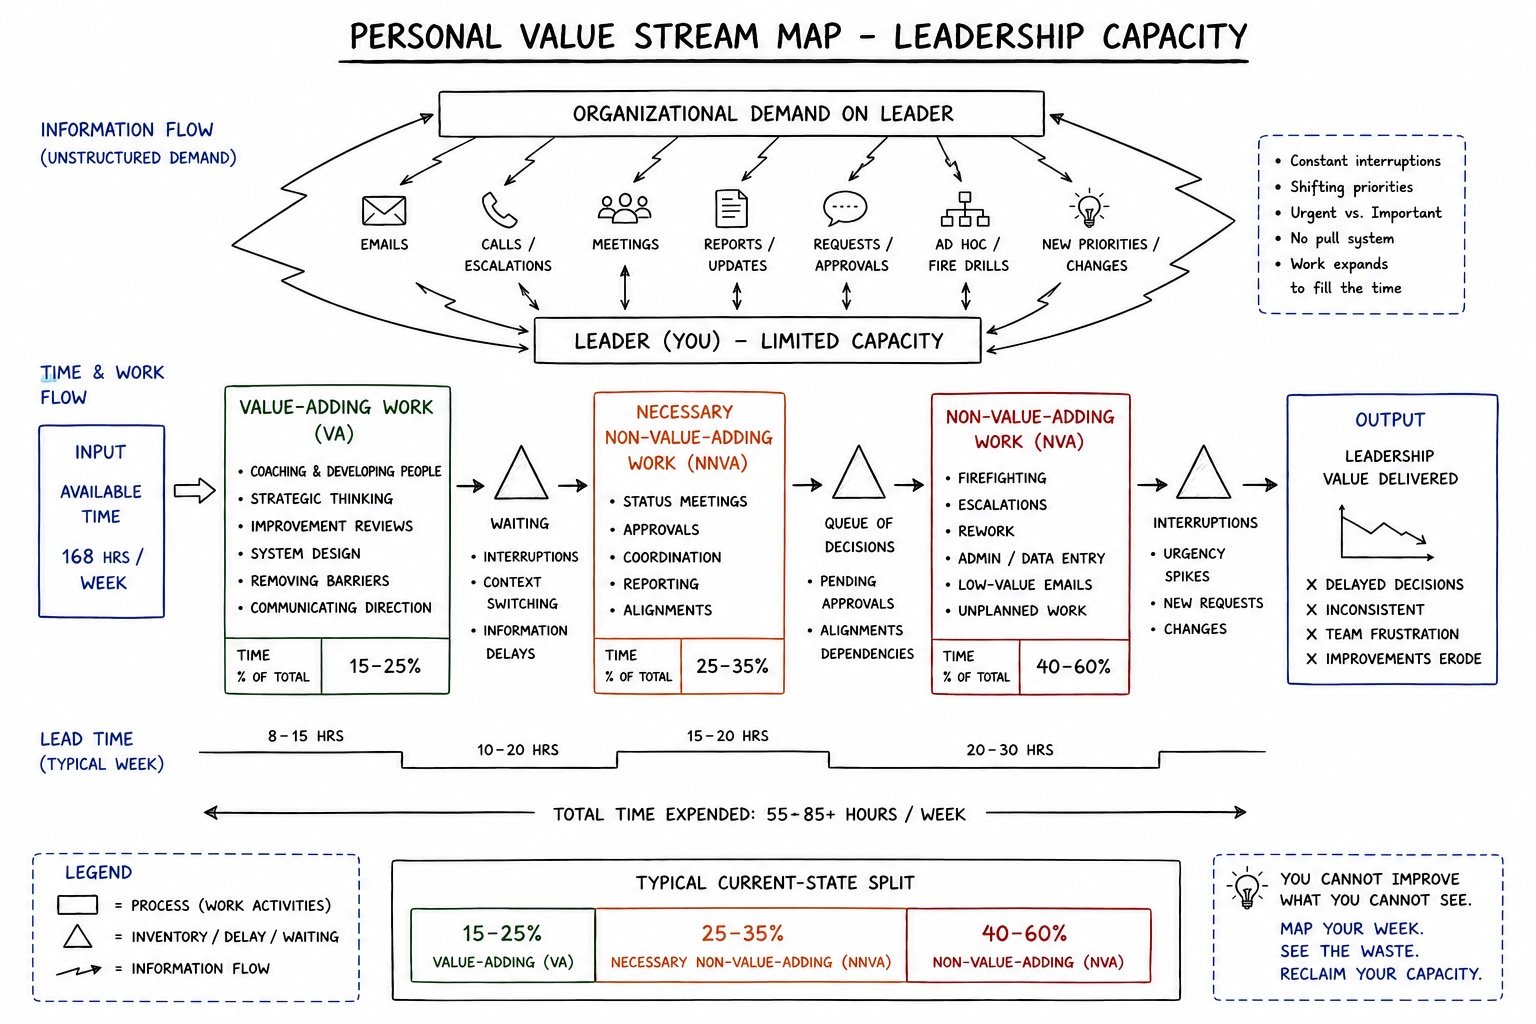
The VP Ops is now carrying: her own leadership responsibilities, the departed engineer’s technical scope, ad hoc CFO reporting prep, and PE firm communication. She has not had a structured 1:1 with the plant manager in approximately 3 months. Her own calendar has no unallocated time before 4 PM on any given day.
The result: two capable people running at or above capacity with no visibility into where the constraint actually lives. The floor is executing against a leadership layer that cannot provide consistent direction, and the financial compression is the downstream evidence of that, not the cause.
The question HWC Asem. Soln. has not yet asked:
Before cutting 10 people, is the constraint in headcount, or somewhere else?
They have seen the picture only through the financial lens, but not through the operational and leadership/people lens.

The Diagnosis
Before any intervention could be designed, actual sources of margin compression needed to be separated and measured. This is where the work began.
The Financial Side:
The margin compression was a result of multiple reasons happening all at once, and none of these reasons were separated and measured.
- Raw material costs: Hydraulic fitting, seals, aluminum extrusions – all had increased by 8% to 11% through tariffs passed through the US-based suppliers.
- Existing OEM contracts were fixed-price until renewal, so the cost increase was being absorbed entirely in the margin.
- The overtime cost itself was a significant cost opportunity. With 176 operators running at $480 over the budget per person per month, the monthly exposure was roughly $84,480 for the past 11 months.
- The overflow storage lease, the indirect labour to shuttle the inventory between the sites, and the insurance for elevated inventory value added extra pressure on the margin compression and was hidden as it was buried in different cost categories.
- The rework related labour cost was never tracked and was hiding inside the direct labour cost for manufacturing
Nobody had ever decomposed all the factors of the costs. Nobody had separated the tariff from the direct labour, or the overtime cost from the indirect labour, or the cost of work on rework, or the cost of labour for managing the new offsite storage. Over time, solutions set up to solve problems in isolation were adding cost throughout the system, and without clean, segregated data, every conversation was about the totals rather than the causes.
The Operations Side:
The shop floor lacked tracking of key metrics, and there was no single source of truth that people could refer to identify any deviations. This left the operators to make decisions on their own, often not fully understanding the impact of such decisions on the overall flow of orders.
- WIP had started accumulating at the sub-assembly staging area, where senior assemblers were being pulled from their stations to expedite priority orders. This disrupted the flow of everything else behind them.
- The second place the WIP was piling was the rework queue. The units failing the first pass inspection were waiting for an engineer to disposition them. With the departed engineer’s role now fragmented across the VP of Operations and a remaining engineer who was still learning the customer spec history, the disposition step had slowed significantly. Nobody owned that bottleneck formally, and nobody was measuring the time units spent in it.
- Order management had no single tracking source. If you wanted to know where a specific order was in the process, you made three phone calls.
- The Monday priority meeting had drifted from 30 minute tight session to 75 to 90 minutes of vague discussions and sometimes frustrated outbursts with no firm action plan. By the middle of the week, the floor was no longer following the priorities, and operators ran the orders based on their judgment.
People reacted to the same recurring issues without trying to implement a solution to prevent them from recurring. When asked, the reply was that there was no time and everyone was focused on getting things out as best as they could. Yes, the people were really working harder, but the outcome was a much more chaotic floor, with orders taking more time than before to complete.
The Leadership Layer:
This is the most important layer and is often not given much importance, as most turnarounds focus either purely on the financial or operational side of the business. What was happening here was a recognizable pattern I had seen so many times across different businesses.
- The VP of Operations was running at Muri (Overburden). She had absorbed the departed engineer’s duties, which she admitted she could perform at about 40% of the previous engineer’s level.
- She had to keep up with the request for ad hoc reporting from the PE firm and the new CFO
- The plant manager had no formal training or process to follow. Lacking any decision frameworks, he made those decisions based on his best judgment and often depended on the VP for sign-off. This often delayed the work on the floor or led to contradictory instructions.
- The new engineer needed updated documentation to operate independently, but that information resided in the VP of Ops’s mind, who had no time.
- With all the overburden and firefighting, the VP of Ops had no time to coach the plant manager or the engineer. She was making every decision herself, as that seemed the fastest way to get things done. But that was preventing her direct reports from learning to take on the responsibilities they were hired for, which would have freed the VP of Ops to focus on strategic work.
This was a classic situation where Muri (overburden), caused Mura (unevenness). Unevenness was seen in the inconsistent decisions and changing instructions to the shop floor. This is what led to the Muda (Waste) downstream. This was the WIP accumulation, excess work to support the same operation, like the material handling needed for off-site storage and rework.
The CFO’s headcount reduction proposal was, in operational terms, an intervention at the Muda end of the cascade, whose root cause had not yet been addressed. Following this proposal without addressing the Muri and Mura would only have made matters worse and would not have solved the margin compression issue.
The Intervention
The engagement was structured into three phases, deliberately sequenced around the authority and budget constraints of the business.
Phase 1 — Operational Diagnostic (Weeks 1 through 4)
This phase was scoped within the VP of Operations’ discretionary spending authority. The work had four outputs.
- A clean EBITDA decomposition: separating the material and tariff inflation, overtime cost, indirect labour cost, and cost of rework related work. This would allow the VP of Ops to produce a clear, current-state financial picture with defensible numbers that she can take to the CFO.
- A single order tracking source: every order tracked in one place, mapped by stage, duration, delay reasons and accountable person.
- Role documentation: Capture the roles and responsibilities throughout the value stream from order receipt to rework and shipping. Capturing what every person actually does, how long it takes, and where the gaps are relative to what the business needs to perform.
- Interruption logging: Key engineering and operations roles recording their daily unplanned interruptions for two weeks and making hidden muri visible before drawing any conclusions.
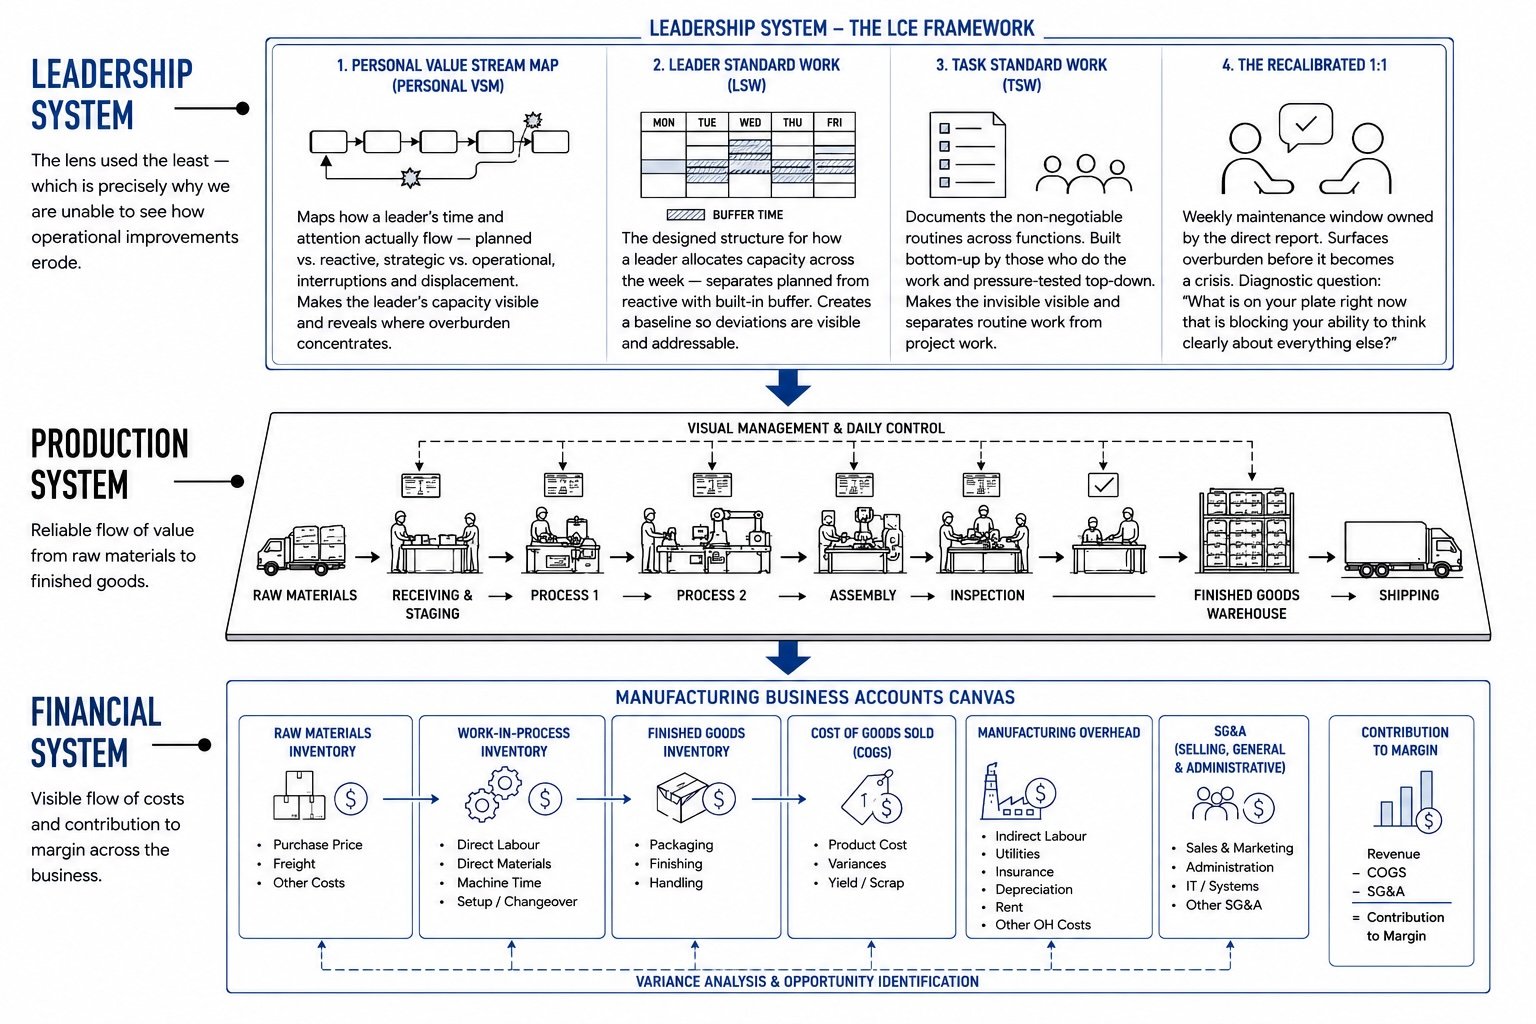
A weekly financial tracking cadence was also established, breaking costs into raw goods inventory, direct labour, Manufacturing overhead, WIP, Finished goods, SG&A. The team was introduced to a visual tool called “Accounts Canvas”, which allowed them to see how the costs were moving through the operations week over week, and not just a monthly EBITDA review.
The Phase 1 deliverable was not focused on metric improvement, though the trend was improving. It was about getting a clear current-state picture that did not previously exist, and a counter-proposal to the headcount reduction based on process data rather than productivity ratios.
Phase 2 — Structure Installation (Weeks 5 through 12)
This was the intervention that required the PE firm’s awareness and approval. The Phase 1 findings were used to achieve this and formed the evidence for choosing a different path from the one initially suggested by the CFO.
- The VP of Operations’ calendar was audited and rebuilt as Leader Standard Work. The target was to create five to eight hours of buffer per week within the first month. This would help her absorb the unpredictable.
- The CFO reporting, which was consuming a significant amount of the VP’s time, was partially automated and partially transferred to the plant manager through a structured development sequence: first participating in the reporting discussions, then doing the work with coaching, then presenting independently when the VP was unavailable.
- The one-on-one structure between the VP and the plant manager was rebuilt as a maintenance window — not a status update. The plant manager owned the agenda. The diagnostic question introduced was direct: what is on your plate right now that is blocking your ability to think clearly about everything else? That question reaches the Muri that status questions never surface. With the direct report owning the agenda and the conversation structured around load rather than project updates, what the plant manager was actually carrying became visible for the first time.
- The plant manager’s standard work was built from the ground up: decision frameworks for the scenarios that occurred frequently, an escalation protocol for the genuinely unknown, and ownership of the priority meeting with clear weekly outputs rather than extended discussions that dissolved by midweek.
- Root cause problem-solving on the assembly line was led by the remaining engineer, coached to lead by the VP.
- Rework disposition moved from the VP’s queue to the engineer’s responsibility, with coaching support rather than VP involvement in individual decisions.
- The overflow storage situation was mapped against its actual causes: which orders were sitting, why, and what combination of smaller purchase quantities, internal space reallocation, and local supplier qualification could reduce or eliminate the need for the off-site facility.
Phase 3 — Advisory (Post-90 days)
This was a monthly retained engagement that kept a thinking partner available to the VP of Operations as the system settled in and new challenges surfaced. The measure of a successful engagement is what happens after it ends. Whether the team can identify improvement opportunities, prioritize them, and execute on them independently.
The advisory role exists to support that transition, not to extend the dependency. Once the team’s capacity is freed, they can develop the capability to operate effectively and efficiently.
The Outcomes
The intervention was designed to move specific operational and financial indicators, not to improve leadership in the abstract. Everything was stated in the language the CFO and the PE firm could relate to.
The Financial Outcomes:
- The overtime opportunity, $84,000 per month at full recovery, was the most immediate and measurable target. Within weeks, the trend was improving and moving closer to the budgeted 4%. This was achieved by addressing the priority sequencing, which was leading to overtime to make up for lost hours.
- The overflow storage lease and cost associated with the additional handling of materials could be addressed once the causes are identified and measures are put in place to eliminate the need for it.
Now, the path to achieving 10%+ EBITDA without headcount reduction was not hypothetical, but based on the sum of the identified and measured cost drivers. The root causes of which were mapped against the interventions and addressed.
The Operational Outcomes:
- On-time delivery toward the 90 percent threshold was the lagging indicator of upstream process and leadership stability. Once those upstream processes and the leadership process were stabilized, OTD improved.
- WIP reduction had started within the first 30 days of Phase 2, making the problem visible, which also made it easy for the team to identify and address the issues causing delays in a timely manner.
- The rework trend declined once the engineer owned the disposition and root causes, which were addressed at the source in a timely manner. By the end of phase 2 the first yield had improved significantly.
The Leadership Outcomes:
- The VP of Ops recovered about eight hours of strategic capacity per week, which changed the entire operations. She was now working on the right things at her level as a leader.
- The VP now uses structured 1:1s for calibration and LSW as a coaching tool with her direct reports.
- The plant manager ran the priority meetings with clear outputs. His making decisions within a framework rather than escalating or stalling, and receiving consistent coaching through a structured one-on-one, helped him remain consistent in how he communicates with the shift supervisors and how they manage the shop floor.
- The engineer was able to make decisions independently and lead the problem-solving program. This helped close the loop on the product-related issues. He was also able to know how much time he needed to protect to deal with review activities vs engineering support for the orders being built on the floor. He developed his own leader standard work, which helped him tackle the work in a planned and efficient manner.
The system was designed to be owned and maintained by HWC’s team at the close of the ninety-day engagement. That was the only meaningful measure of success.
What This Case Is Actually About
The headcount reduction that was nearly implemented at HWC Assembly Soln. would have removed people from a system that was failing because the leadership system above them was not designed. It had no standard work, no buffer, and no visibility into its own capacity. Cutting positions from the floor to recover the margin that the leadership process’s Muri was consuming would have reduced the organization’s ability to recover, at exactly the moment it most needed to.
The CFO’s analysis was not dishonest. It was a legitimate reading of a productivity ratio in an EBITDA-compressed operation. What it could not see, because the data for it did not exist yet, was where the compression was actually originating. A revenue-per-employee ratio tells you what has happened. A process map tells you why.
The cascade that produced these business results had a specific sequence. Muri at the leadership layer, overburden with no standard work and no buffer, produced Mura in the direction and decision-making that the shop floor received. Mura produced Muda: overtime as recovery labour, rework sitting in a queue, re-alignment meetings that should not have been necessary, engineers spending their capacity on work that had to be redone. The financial effect was real. Its source was in the leadership system, not in the headcount.
This is the problem that lean programs consistently leave unaddressed. The tools work on the floor. The discipline holds when the leadership layer above it is stable, clear, and operating within its designed capacity. When that layer is overloaded and produces variable output, the shop floor cannot maintain process stability.
The turnaround delivers a result. The transformation requires engineering the layer that makes the result hold.
That is the work.
Disclosure: This case study is a composite illustration built from recurring patterns observed across more than twenty years of manufacturing operations leadership, including direct experience with post-acquisition integration, margin compression, and leadership capacity constraints. The company name, individuals, specific financial figures, and operational details are constructed for illustrative purposes and do not represent any single client engagement. The patterns, sequence of diagnosis, and intervention structure reflect a composite of real operational dynamics commonly seen in PE-backed manufacturing environments.